
 Rich Davies is Ark's Director of Insight. He is responsible for bridging the gap between the organisation's data and action. He leverages data analysis to advise senior leaders and works to ensure that all Ark leaders, teachers and students can make data-informed decisions. He has overseen the development of Ark's award-winning data analytics systems and has led reviews of assessment, curriculum, destinations and many other key areas.
Since the KS4 and KS5 ‘league tables’ were published recently, a lot has been written about the negative consequences of this annual practice. From encouraging gaming to school-shaming, most of the criticisms levelled are valid, but I worry that the blunt solution that many propose - the abolition of published schools’ data – does not pass the cost-benefit test.
This is not because I dispute the costs that others have identified, but because I believe there are real benefits to the level of transparency we currently have. I also believe (hope?!) that the costs identified can be mitigated without losing these benefits.
The most common political argument used to defend school performance tables is ‘accountability’. I am not going to make that argument. There may be something to it, it may be flawed logic. Either way, it does not contribute much to my thinking on this topic.
Another common pro-publication argument is ‘parental choice’. As a parent, I must confess I consulted published schools’ data (as well as a range of other qualitative sources, honest!) when thinking about my own children’s schooling. But given the relationship between school proximity and house prices, I am reluctant to base my argument on such a politically contentious issue(!)
What I hope is less contentious is that all schools want to improve outcomes for their students. And this is why I believe that published schools’ data is a good thing that could be improved, rather than a bad thing that should be abolished.
During the past few years, I – and countless others in schools, MATs, LAs, think-tanks, charities and Universities – have analysed published data-sets in order to inform school improvement decisions and actions. This information helps us place our own data in perspective and helps us understand the art of the possible, as well as the scale of the challenges we face. Many have argued that context is key and I would not disagree, which is why I’m glad the published data-sets go way beyond just academic outcomes. The Compare School Performance website contains all of the following data-sets for all schools: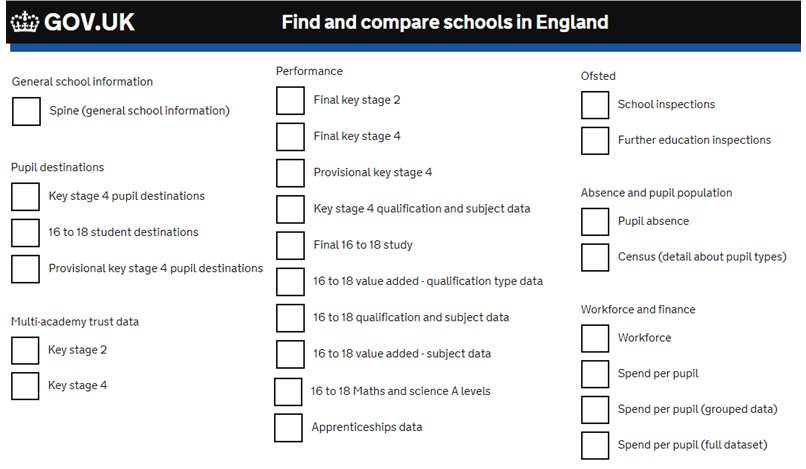
Additional sources include Schools Financial Benchmarking and the marvellously named Get Information About Schools, while ‘underlying data’ files tucked away in many of the DfE’s statistical releases provide similarly granular information on exclusions, mobility and other relevant measures.
For the apparent majority of schools currently wrestling with their approach to curriculum, I heartily recommend blending the Key stage 4 qualification and subject data table with the Census and Final key stage 4 data. Combining these sources helps illustrate how many - and which - schools with extremely challenging contexts have managed to improve outcomes while maintaining a broad and balanced macro-curriculum. Similarly, blending in Workforce, Spend and Financial Benchmarking data helps identify schools that have navigated difficult financial circumstances while delivering positive outcomes for students.
With all this in mind, I can’t help but think of the parable of the blind men and the elephant. Each published school measure in isolation is a different part of the elephant, and each of us who only analyses one measure is as blind as the men in the parable. But surely the solution is not to shoot the elephant or to impose accessibility restrictions at zoos; it is to cure blindness. While such a cure might still be medically out of reach in literal terms, our metaphorical blind men - i.e. those of us working to improve student outcomes - are in luck…
As I’ve hopefully illustrated above, it is possible to blend together the many published sources available to build a clearer (but admittedly still imperfect) picture of our schools. Of course, it is better still to see a school for yourself (and ideally for more than two days!), but since there are over 20,000 of them to choose from, published data sets at least help us know where to start. And even if we can’t visit all the schools we identify with our analyses, simply knowing how many of them exist helps us understand what’s possible and how difficult it will be to get there.
Which brings me back to my all-important caveat. Yes, I believe that published performance data is a good thing, but I’m also saying that it could and should be improved. The main technical improvement I would advocate is better integration of data-sets, both across measure types and over time. The types of analysis I’ve described above are still difficult to perform because they require analysts to blend data sources themselves. And even less complex analyses like measuring changes in the same measure over time are difficult because each year’s data-set is separate and often structured/coded slightly differently.
We at Ark have spent a lot of time piecing these disparate data-sets together and are planning to share these consolidated sources more widely soon. Meanwhile, others like Assembly and the Education Endowment Foundation have also made great efforts to make this data more accessible.
A related methodological improvement would be to include more nuanced measures that do some of this blending for you. Many have advocated the return of contextual factors into progress measures while the DfE have also mooted the introduction of improvement-based measures for some time. Both of these additions would require careful design, but – if done right – could enhance our understanding of our schools.
But technical and methodological improvements are not enough – what we really need is to improve the culture surrounding published schools’ data. Unfortunately, culture is much harder to change than technical systems or statistical methodologies, but we have to try. I do believe that the integrations and measures I’ve described above could help facilitate this culture change, but only if we are willing to open our minds to what this data can and can’t do.
For the ‘accountability’ and ‘parental choice’ advocates, that means accepting the imprecision of published schools’ data and making necessary allowances. It also means acknowledging the perverse incentives that are created by overly focusing on one part of the proverbial elephant.
But those of us working in and with schools would benefit from a culture change too. We need to recognise the value this data provides and make better use of it to inform our school improvement decisions and actions. Otherwise, we risk being the blind leading the blind.