Opinion20th August 2019

Rich Davies is Ark’s Director of Insight. He is responsible for bridging the gap between the organisation’s data and action. He advises senior leaders on strategic issues and works to ensure that all Ark leaders, teachers and students can make data-informed decisions. He has overseen the development of Ark’s award-winning data analytics systems and has led reviews of assessment, curriculum, destinations and many other key areas.
Results days usually generate a lot of data analysis. Hopefully, school leaders and teachers will use this analysis to inform their decisions for the year ahead. But our students also face critical decisions about next year and beyond. Shouldn’t data analysis help inform their decisions as well?
Clearly, I am not proposing that students should spend results day analysing their exams data. After all, that data only tells them about where they’ve been, while the decisions they now face concern where they are going. But I am proposing that the discussions we have with students before, during and after results day could benefit from incorporating high quality destinations data — i.e. where students plan to go and what they plan to do when they get there.
A few months ago, I defended the DfE’s decision to publish schools’ data. I argued that schools could use this data to identify and learn from their strongest peers. I also talked about how blending internal and published data sources could help schools make more informed decisions. The same is true for students. Blending students’ internal destinations data with published Key Stage 5 (KS5) statistics can help inform higher quality discussions and decisions around post-16 options.
Three key areas where published data can help inform these discussions include:
1. Provider pathways; 2. Course outcomes; 3. Individual challenge.
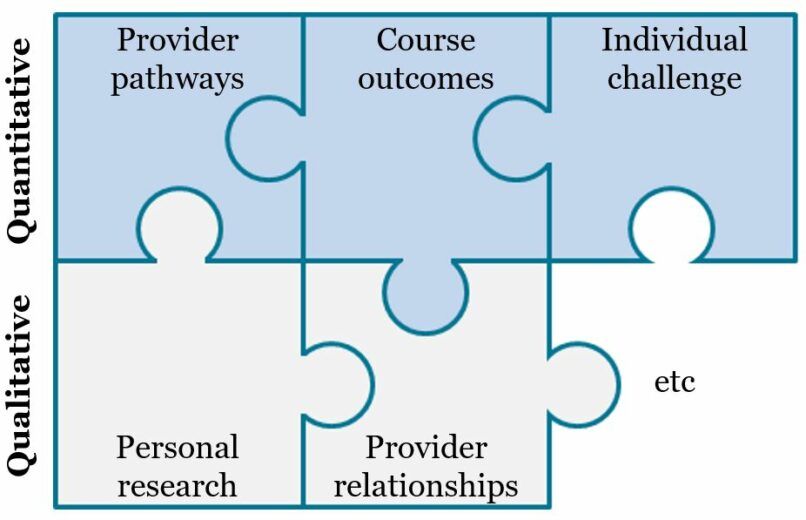
1. Provider pathways: How successful is this provider at retaining students throughout their studies and progressing them onto higher level pathways?
Historic data for retention can be found here (within the ‘PT_Retained’ fields) while progression rates to higher education can be found here (within the ‘HE’ field). These two sources also contain several other useful measures, but the above two are probably the most informative within this context.
2. Course outcomes: How strong are the results for this course at this provider?
Historic attainment data for each course at each provider can be found here while ‘value added’ data — i.e. average attainment, adjusted for the intake’s KS4 performance — can be found here. (N.B. Apprenticeship achievement rates can also be found here, but the DfE advises that this data is not strictly comparable across different providers)
3. Individual challenge: How likely is a student with this KS4 attainment profile to secure good outcomes within this course?
National transition matrices, which show the probabilities of students with different KS4 attainment achieving various outcomes in each course, can be found here. To adjust this picture for specific providers, you can approximate using their course ‘value added’ score, which shows the number of points higher or lower an ‘average’ student might be expected to achieve at that provider. For example, if a student appears most likely to achieve a D grade based on national transition matrices, but the provider has a ‘value added’ score of 1.0 for that course, the student’s most likely outcome may actually be closer to a C grade at that particular provider. Of course, these probabilities do not take each student’s individual circumstances into account, but they do at least provide a baseline for discussion.
All of the above data is most useful when used comparatively. Knowing a given provider’s values is not that helpful in isolation, but knowing that these values are higher or lower than potential alternatives could be very helpful. And in order to understand what these potential alternatives are, schools need to have a good understanding of the different courses that their students are considering, as well as the various providers available to them.
Schools are more likely to know about students’ preferences and available providers if their own internal destinations information gathering is:
Timely – i.e. Intended destinations options are discussed and recorded well in advance of final decisions and are regularly updated throughout the year
Rich – i.e. Recorded information includes all options being considered, course-specific preferences as well as other relevant commentary
Enduring – i.e. Schools have a consistent record over time of previous cohorts’ intended and confirmed final destinations
Unfortunately, most schools’ management information systems (MIS) do not yet offer particularly rich — if any — destinations capture or analysis tools, but we expect that MIS vendors and/or aligned third parties will fill this functionality gap within the coming years. In the meantime, bespoke approaches like spreadsheets are still worth the effort, provided they are used to help inform decision making and student discussions.
It goes without saying that these kinds of discussions cannot rely solely on data. Students, teachers and advisers should also draw upon multiple qualitative sources – including personal research and provider relationships – to help inform and enrich these conversations. Students’ own research should include site visits, meeting with students/alumni and checking requirements for potential further studies (which can be done here). Meanwhile, schools should prioritise relationship-building with providers that take on a large proportion of their students and/or best meet specific student needs. This qualitative aspect is especially important when considering work-based apprenticeships, which cannot currently be evaluated using the data sources listed above. But while data cannot provide an adequate substitute for targeted research and relationships, it can provide an informative complement to them — especially when it blends together internal and external sources.
At Ark, our mission is not just about improving our students’ exam results, it’s about enabling them to choose the future they want – be that at a great University, a high quality apprenticeship or wherever their vocation leads them. Destinations data therefore provides a more meaningful ‘key performance indicator’ than Attainment 8 or EBacc ever can. But while this data is undoubtedly important for us to scrutinise, it is even more important for our students to understand as they navigate their journeys towards the best possible destinations.