Opinion19th March 2019
 Rich Davies is Ark’s Director of Insight. He is responsible for bridging the gap between the organisation’s data and action. He leverages data analysis to advise senior leaders and works to ensure that all Ark leaders, teachers and students can make data-informed decisions. He has overseen the development of Ark’s award-winning data analytics systems and has led reviews of assessment, curriculum, destinations and many other key areas.
A few weeks ago I took what felt like a bit of a risk by defending the publication of schools’ data. But that post now feels comparatively risk-free compared with what I am about to write. I realise that some may see this male-authored analysis as yet another example of ‘mansplaining’, but hopefully most will see it as a call for greater data transparency in support of gender equity.
All organisations above a certain size are required to analyse and publish the difference in average salaries between genders. Ark is no different, and our published data can be found here.
If you already know a bit about Ark and clicked on the above link, you may well be feeling a bit surprised right now. One might reasonably assume that an organisation with a female CEO, a female CFO, female Directors of Primary and Secondary Education, as well as majority female functional and regional leadership, would have a below-average (or even reverse) gender pay gap. But one would be wrong. And, while I’m apprehensive about entering this debate on account of my Y chromosomes, I hope I can at least share what I’ve learned from analysing our data further.
Many people assume that the existence of an organisational gender pay gap reflects the fact that men are paid more than women for holding the same roles, but published gender pay gap measures do not tell us whether this is happening or not. In Ark’s case, there is no pay gap for any particular role; our male and female principals, middle leaders, teachers etc are all paid about the same as each other. So how is it that there is an overall gap?
The answer lies in the fact that different roles command different salaries. Our highest paid employees are, unsurprisingly, our school principals, who are paid more than middle leaders, who are themselves paid more than classroom teachers. The roles with lowest average pay are cleaners and caterers, followed by classroom and operations assistants. Ark’s gender pay gap stems from differences in the proportions of men and women occupying these roles.
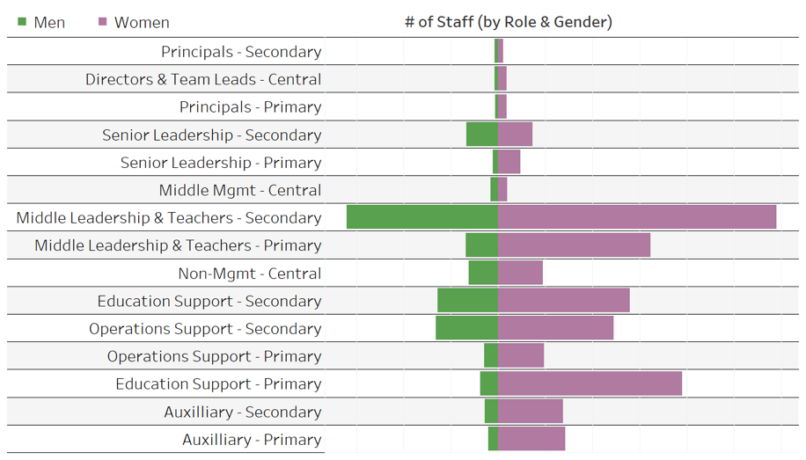
At this point, some might assume that the majority of our principals are men and the majority of caterers and cleaners are women, but this assumption would only be half right. In fact, women make up the majority of staff within every role in our organisation. Our gender pay gap is therefore driven by the extent of this majority within each role.
Specifically, three trends – each with increasingly significant impact – help us understand our gap.
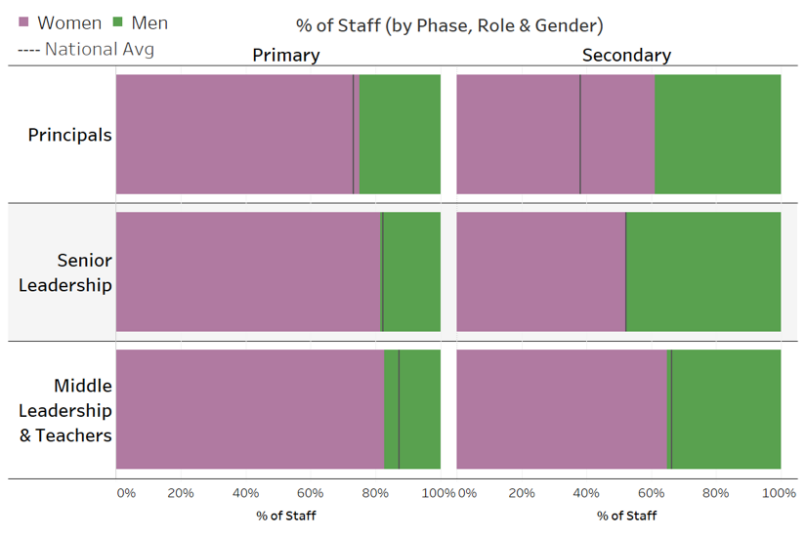
The first trend is the promotion funnel for teaching staff – i.e. comparing the male-female ratios for classroom teachers/middle leaders vs. senior leaders vs. principals. A truly gender-blind promotion funnel (that is, with no gender biasing from either an employer or employee perspective) would show the same ratios at each layer. This is mostly the case at Ark, which is why this trend only accounts for ~15% (i.e. 1-2ppt) of our gender pay gap.
The second trend, which is also visible from the above chart, is the difference between primary and secondary school teaching workforces. Ark resembles the national picture in that a primary teacher is only half as likely to be male as a secondary teacher. And because national secondary teacher salaries are higher than primary ones, this difference actually accounts for another ~20% (i.e. ~2ppt) of our gender pay gap.
But both of these patterns are dwarfed by the impact of the third trend – the relative dearth of men in support/auxiliary roles (e.g. teaching assistants or caterers) – usually the lowest-paid positions in a school. In fact, this mismatch accounts for a whopping ~65% (i.e. ~9ppt) of our overall gender pay gap.
The big challenge with interpreting and reacting to these trends is that they are increasingly structural. Ark is not unusual in having very few male support staff; we actually have above-average gender equity at this level. And as the above chart shows, we also have much more representative promotion funnels and a more balanced primary teaching population than the national average. But the sector as a whole is predominantly female and especially so in primary schools and support/auxiliary roles.
While we can and must do everything we can to ensure that our recruiting, promotion and other workplace practices do not discriminate against either gender (or any other group), we are ultimately exposed to a wider labour market that still reflects centuries of structural bias. Not just in terms of the roles that different genders are more likely to fill, but also the perceived value the market places on these roles. There is no doubt that these biases are shifting at an unprecedented rate (e.g. the above analysis would have looked very different in previous decades), but as long as they persist to some extent, simplified metrics like the ones currently published will reflect structural trends as much as organisation-specific ones.
That’s not to say that we shouldn’t analyse these metrics for each organisation. After all, big structural changes are ultimately the product of myriad smaller ones, and data transparency is a proven driver of behavioural change. Critics of data transparency often cite the risk of perverse incentives and ‘gaming’ but – as I argued in my previous post on schools data – I believe the best way to mitigate these risks is by expanding our analyses and using them more proactively to illustrate the art of the possible.
As things stand, multi-school organisations like ours could decrease our apparent gender pay gap by simply outsourcing auxiliary/support roles or even by changing our mix of primary and secondary schools. And yet neither of these things would really change anything. Conversely, if we had visibility of the gender ratios for each role at other MATs and LAs, we could identify and learn from organisations that have achieved greater gender equity despite facing the same structural biases. For example, Ark’s more representative promotion funnels likely reflect policies and practices that could be replicated elsewhere. This data is already being collected to generate national school workforce statistics, so publishing it at a more granular level could provide a low cost way to facilitate more meaningful change.
Of course, the schools sector does not exist in a vacuum, so sustainable change would also depend on reciprocal shifts within other sectors. Many sectors have less comparable role structures than schools do, but that wouldn’t necessarily make role-based analyses meaningless for them. And even if some sectors cannot be analysed as effectively as schools, it still makes sense to analyse those that can.
Ultimately, no data or metric will ever provide a perfect understanding of what is being measured – be that school performance, gender equity or anything else. But the most useful metrics are usually those that require the least explanation.