 Rich Davies is Ark’s Director of Insight. He is responsible for bridging the gap between the organisation’s data and action. He advises senior leaders on strategic issues and works to ensure that all Ark leaders, teachers and students can make data-informed decisions. He has overseen the development of Ark’s award-winning data analytics systems and has led reviews of assessment, curriculum, destinations and many other key areas. This blog is part of a series on Ark’s approach to curriculum.
Introduction
To borrow a description from Zoolander, curriculum is “so hot right now”. Everybody’s talking about it: the DfE, Ofsted, the professional bodies, the trendy conferences… But what are they actually talking about? And are they always talking about the same thing?
For example, there has recently been some debate around whether Ofsted has a “preferred curriculum”. While many claim that they do – citing Ofsted’s references to the EBacc, others insist that they don’t – citing Ofsted’s stated neutrality on knowledge-led vs. knowledge-engaged vs. skills-led approaches. But debates like this are impossible to resolve, since these two positions refer to quite different definitions of ‘curriculum’.
At Ark, we try to avoid this kind of stalemate by distinguishing between ‘macro-curriculum’, ‘design architecture’ and ‘delivery architecture’. This blog series explores all of these aspects of ‘curriculum’, but my posts will specifically focus on macro-curriculum – the subjects and qualifications we teach, their availability to different students, and the resource we invest in teaching them.
All schools have made and continue to make critical decisions around macro-curriculum, even if they have only done so implicitly. My objective is to help make some of these implicit decisions more explicit, as well as informing them with data where possible. This data will predominantly refer to KS4, since this is the level at which national data is most readily available. However, the same decisions will generally apply to KS3 and many will also apply to the other secondary and primary key stages.
The three types of macro-curriculum decision I will explore are:
- Student entitlement
- School breadth
- Lesson context
1. Student entitlement
‘Student entitlement’ decisions determine what each individual student can experience in terms of their own personal macro-curriculum.
How many subjects/qualifications should an individual student take?
– If this should differ by student, by how much and under which circumstances?
Should an individual student take vocational subjects/qualifications?
– If so, how many and under which circumstances?
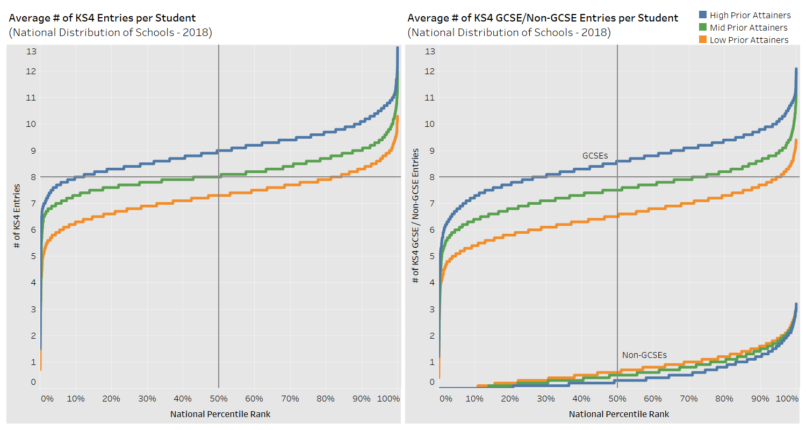
Looking at the national picture, we can see that a ‘typical’ (i.e. median) student takes 8 qualifications at KS4, which increases to 9 if they are a high prior attainer or decreases to 7 if they are a low prior attainer. 90% of high prior attainers take 8+ KS4 qualifications, compared with 50% of mid prior attainers and only 20% of low prior attainers.

Source: DfE Compare Schools Performance – Final KS4 2017-18
This distinction between high, mid and low prior attainers is most pronounced for GCSE entries and is only partially offset by a smaller reverse trend for vocational qualifications. In other words, a low prior attainer is far more likely to take fewer GCSEs, but is only slightly more likely to take more vocational qualifications in their place. As a result, they typically end up taking fewer qualifications.
However, the slope of these curves suggests that the number of qualifications a student takes is just as dependent on the school they attend as on their prior attainment level. For example, a high prior attainer who happens to attend one of the 10% schools on the left hand side of the chart will actually take fewer qualifications than mid-prior attainers at 50% of schools and even low prior attainers at 15% of schools. Similarly, the tightly packed nature of the Non-GCSEs curve suggests that the number of vocational qualifications a student takes is primarily dependent on the school they attend, rather than their prior attainment level.
Should an individual student take at least one Science, Humanity, Language etc?
– If not, how many and/or which?
– If this should differ by student, how & under which circumstances?
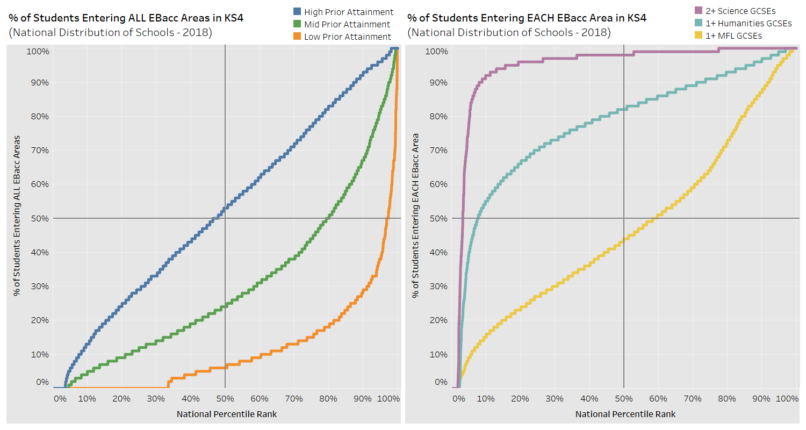
Nationally, this kind of data is collected for the EBacc and its component subject areas, but not for other subject areas like performing arts, creative arts etc. Most schools’ EBacc entry rates differ considerably based on students’ prior attainment levels. A ‘typical’ school enters 50% of its high prior attainers into all areas of the EBacc, as opposed to 25% of its mid prior attainers and <10% of its low prior attainers. High prior attainers have 50%+ EBacc entry rates at half the schools in the country, while mid-prior attainers only see these rates at one in five schools and low prior attainers only see this at one in twenty.

Source: DfE Compare Schools Performance – Final KS4 2017-18
Looking at entry rates for each of the EBacc areas separately, it’s clear that Modern Foreign Languages (MFL) has the lowest entry rates at most schools. More than nine out of every ten of schools have Humanities entry rates above 50%, while only a third of schools have similarly high entry rates for MFL. As such, a ‘typical’ school is likely to have ~100% Science entries, >80% humanities entries, but <50% MFL entries.
However, as with the number of entries per students, it’s clear that whether or not a student is entered into the EBacc is as much a function of the school they attend as their prior attainment level. Furthermore, while Science entry rates are fairly similar across >90% of schools, humanities and MFL entry rates differ quite significantly between different schools.
When should a student begin choosing fewer subject options?
– If this should differ by subject or student, how & under which circumstances?
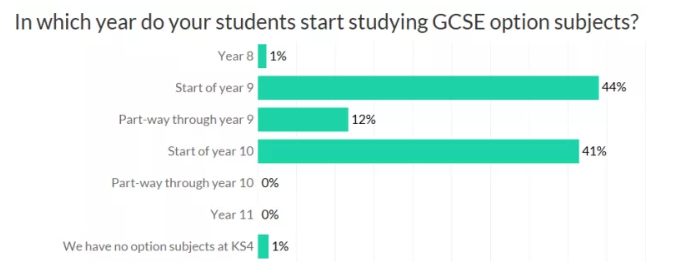
There is no official data on this question, but research by Teacher Tapp suggested that only ~40% of schools wait until the start of Year 10 to begin narrowing students’ options (in line with Ofsted recommendations). Meanwhile, ~45% of schools narrow options from the beginning of Year 9 while another ~10% narrow options at some point during Year 9. Another ~1% of schools actually narrow student options from Year 8 onwards.

Source: Teacher Tapp – 19th November 2018 (Question 2)
Given the EBacc entry rates shown above, as well as the KS4 subject participation rates we will look at in my next post, this means that most students in most schools are experiencing a maximum of two years of secondary teaching in humanities, languages, performing arts, creative arts and other ‘non-core’ subjects.
So what?
When deliberating all of the questions outlined above, schools need to ask themselves “what are our students entitled to?”. They should then seek to understand where their answers put them on the national spectrum and consider how their own unique context influences these decisions. There is not necessarily a ‘right’ answer to any of them, but schools need to feel confident that they have made these decisions on behalf of their students in an informed way.
In my next post, I will look at ‘school breadth‘ decisions.